From 30 seconds to 39 milliseconds in one morning (and it wasn't only the model)
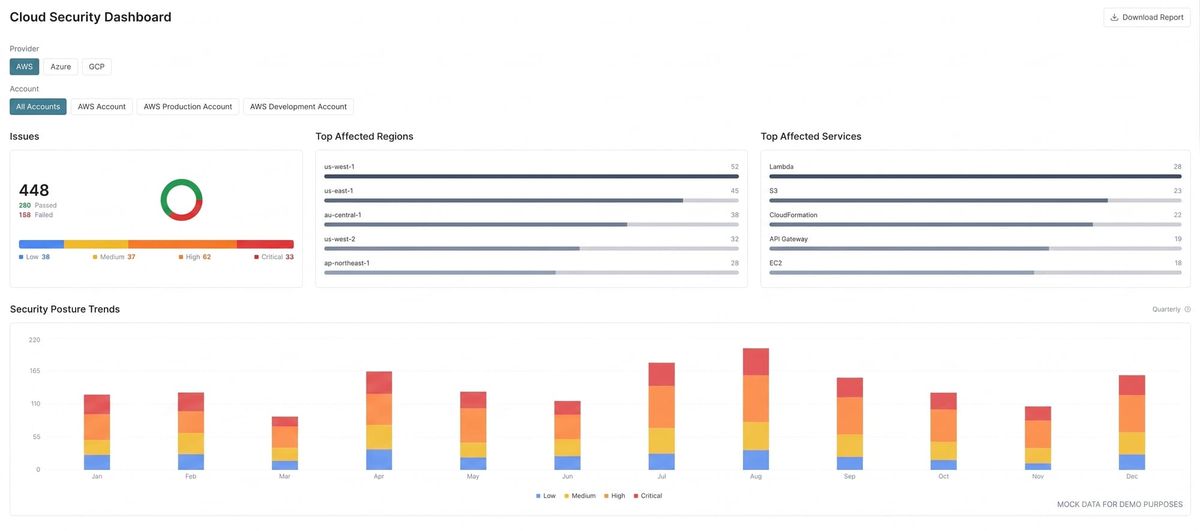
Last Wednesday morning we had a session with a customer, sharing screen, showing them the platform. We opened Cloud Audit, our CSPM section where we show the misconfigurations of their AWS, Azure or GCP accounts, and... it didn't load. There had been a lot of activity on the platform that day, and this customer has a lot of data in that section. The page just stayed there, thinking.
The funny thing (not so funny during the call) is that it wasn't a surprise. We knew that section was slow. I knew some indexes were missing and that other things could be done. Some time ago I even asked Claude Code to improve it, but the answer was not clear, a list of "you could do this, you could do that", and I didn't have time to dig into it. So it stayed in the backlog, like so many things.
This time, I opened a new session with Opus 5.5 (launched the day before) and I thought "let's test it!". Two hours later there were five stacked pull requests, the dashboard went from 30 seconds to 39 milliseconds, and I had been doing other things in the meantime.
In this post I will talk about:
- How the session started: reproduce first.
- The root cause, which was not the one I expected.
- The five PRs and the numbers.
- Why I think it's not only the model.
- What we still need to improve.
1. Reproduce first
This was my first prompt, typos included:
the cloud audit dashboard has performance issues. The queries in the database take too long, even blocking it. I need you to do performance tests, review the code and the queries and propose a plan to fix it. but first, you should be able to reproduce the issue so we are sure that the fix is good
The first thing it did was load a debugging skill and say:
Using systematic-debugging: reproduce and find the root cause before proposing any fix.
After reading the code, it came back with a plan with four hypotheses (a whole-table aggregate on every call, a missing index, a recent regression and too many concurrent scans) and a table of every query the dashboard runs per cloud account. I rejected that first version, though. It wanted to hand me a pack of read-only queries to run against production and dev, and then generate synthetic data locally to reproduce the problem. I thought that loading a local copy of production, anonymized (yes, anonymized, before anyone asks 😉), would be faster and would need much less time from my side, so I pointed it there. It rewrote the plan around that: a Postgres 16 container, restore the copy, run ANALYZE, and write a benchmark script that calls the real persistence functions and reports p50/p95. That script has a nice detail that I didn't ask for: it refuses to run against anything that is not localhost.
Fifteen minutes after my first prompt, the problem was reproduced: 12 seconds per dashboard load for one customer, 30 seconds for our own organization.
2. The root cause
I was sure that the missing index was the culprit. And yes, it was part of the problem, but there was something worse behind it.
Found it: the planner is running the latest_scans aggregation subquery inside a nested loop for every muted failing row, re-scanning the whole 430k-row table each time.
Let me explain. Every Cloud Audit query needs to know which is the latest scan of each cloud account, so it joins with a max(last_seen) GROUP BY account_id over the results table. That aggregate had no filter, so it computed the latest scan for every organization on the platform. And for the query that counts muted findings (a muted finding is one that your company decides to ignore for an internal reason, kind of a false positive: you mute it in our platform explaining why, and later an auditor reviews it), Postgres decided to put it inside a nested loop and re-run it once per muted failing finding. For our own biggest account that was 271 times, so 14.9 seconds for a single query. And the dashboard ran that query twice per account, one account after another.
Then it tested concurrency, and this explained what we saw during the call:
under 5 concurrent loads, dashboard latency jumps from 12s to 45s p50 because 14 backends get pinned on CPU from parallel seq-scan workers, which explains the DB blocking on RDS with limited vCPUs and a 10-connection pool.
The home page calls the same dashboard function, so every user opening the home page was paying this cost, even if they never opened Cloud Audit.
The part that I liked most is that, before writing any code, it tested every variant in SQL to see what each change does on its own:
| Muted-counts query (worst account) | Without index | With (account_id, last_seen) index |
|---|---|---|
| Current query | 16.6 s | 3.4 s |
| Latest scan limited to the org's accounts | 14.0 s | 7.8 ms |
So the index alone gives you around 5x, and scoping the query to the organization alone gives you almost nothing. But with both together the query is around 2,000 times faster. That's why it proposed to start with the first two PRs at the same time: "Should I start with PRs A and B together? Neither one fixes it alone."
It also said this was probably a recent regression, introduced with some changes about stale findings two weeks before, but it was honest that it hadn't benchmarked the old code to confirm it.
3. Five PRs, PR by PR
The plan was split into small stacked PRs, which is how we like to work because Yarilo (or anyone) can review them one by one. The stack ended up like this:
- #1942 – The index. One
CREATE INDEXoncspm_results (account_id, last_seen)and the benchmark script. It measured the index build on the full-size table (0.7 s), so it decided a plainCREATE INDEXwas fine instead ofCONCURRENTLY, which our migrator doesn't support anyway. - #1943 – Scope the aggregate to the organization. Tests first, seen failing, then the fix. The views keep the unscoped version because a
CREATE VIEWcan't take a parameter. - #1946 – The dashboard panels. The "top regions" and "top services" panels read views that were fast only because the planner happened to push the filter down. We were lucky, and I prefer not to depend on luck, so now they're scoped explicitly, and the muted counts are computed once instead of twice.
- #1947 and #1948 – Lighter Misconfigurations page. More on these two below.
After each PR it checked that the output was the same: the dashboard, findings and cloud accounts responses were identical for all the organizations in the copy. Then it ran the whole matrix again in one session so every PR description has the same table:
| Dashboard (p50, local copy) | Before | After the stack |
|---|---|---|
| Customer A | 11.8 s | 43 ms |
| Qalea (our own org) | 28.6 s | 39 ms |
| Customer C (18 accounts) | 3.5 s | 207 ms |
| Customer A, 5 loads at once | 38.5 s | 68 ms |
It didn't just tell me I was right (twice)
In the middle of the session I asked if pagination in the UI would help. It was the first thing that came to my mind (and also to Yarilo's when he read the draft of this post), so I kind of expected a "yes, good idea". The answer was no, and the reason was clear:
On the dashboard there's nothing to paginate. The page only shows totals, per-severity counts, a 12-month timeline, and the top 5 regions and services. All the time goes into the database computing those numbers.
And instead of leaving it there, it went one step further. It checked the Misconfigurations page, found that it already paginates, but on the client, over a list that is fully loaded, and it measured what we were sending: tens of megabytes of text (description, risk, remediation) for every finding, text that only the side drawer shows. It proposed a cheaper option than full server-side pagination: don't send those texts in the list and load them when you open a finding. That became #1947 (backend) and #1948 (frontend):
| Finding data sent to the browser | Before | After |
|---|---|---|
| Customer A | 38.8 MB | 17.7 MB |
| Customer B | 102 MB | 47 MB |
| Customer C | 118 MB | 48.5 MB |
Yes, 118 MB of JSON. Don't judge us 😅.
The second time, I asked "what is the benefit of PR C actually?", because its original plan was a big rewrite of the dashboard into a few organization-level queries. The answer:
PR C isn't needed to fix the incident; PRs A and B already do that. What's left is smaller speed gains and one real robustness gap.
It measured where the remaining time was going and proposed a smaller version with most of the benefit and much less regression risk. And after doing it:
My estimate was off: [customer C] went from 265 to 193 ms, not the "few tens of ms" I predicted.
What about security?
We are a cybersecurity and compliance company, so the new endpoint that returns a finding's texts had to be scoped to the organization. It checked that 490 sampled findings returned exactly the same text as before and that asking for a finding of another organization returns nothing. And remember that all of this ran on my laptop, against the anonymized copy, never against production.
Reviews still matter
When I was reviewing #1943 I saw that the new organizationId parameter was optional and asked why. It explained that the views still need the version without an organization, and then:
The optional parameter is a trap, though. A new caller that forgets the org gets the unscoped whole-table aggregate that caused this incident, and nothing flags it.
It proposed to make the parameter required and create a separate, explicitly named function only for the views. This is the kind of thing that a good review catches, and that's why Yarilo also reviewed the whole stack. The model is fast, but the decision of what gets merged is still ours.
The timeline, if you're curious: first prompt around 11:35, root cause at 11:52, the first two PRs open at 12:18, the five PRs done at 13:07, and a merge conflict with somebody else's migration fixed at 13:24. Around 66 minutes of model work.
4. It's not only the model
Lately I have been talking a lot with Yarilo about how fast we are going. And we agree that one part is the new models, no doubt. Opus 5.5 is another level: the old attempt gave me a list of ideas, this one gave me a reproduction, a root cause and numbers. But the other part is that we have been tuning the project for months, and you can see it in the session:
- A good architecture. The code is split into clear layers (persistence, services, API routes, components), so the model found the whole query path in a few minutes. It was a "small, focused surface", in its own words.
- A good AGENTS.md. Commands, conventions, what not to do (for example, don't run
npm run buildinside the agent session). When it had the migration conflict, it said "I'll regenerate my migration on top of theirs and merge rather than rebase, per repo practice". I didn't have to tell it anything. - Short, well-defined skills. We have 19 in the repo, each one for a layer or a process:
database,persistence-layer,api-routes,test-driven-development,create-pr,pr-screenshots... It wrote the tests first and saw them failing because the skill says so. It's not part of this story, but for every UI change it also takes the screenshots at 1440×900 without the dev overlay, and creates or updates the related E2E tests, because the skills say so. - Guardrails that catch the model too. The pre-commit hook runs lint and the type check. It caught type errors that the unit tests didn't, and some throwaway scripts that the model had left in the repo.
And there is one more thing that is not technical at all: Laura, our not-product-manager, is sharing much more specific things about what needs to be delivered, including designs. In the end, the better we explain what we want, the better the result, with a model or with a person.
5. Where we're still slow
It's not all perfect, and I think it's fair to say it:
- Agent reviews. We used to get free reviews from the Gemini app in GitHub, but it no longer works with our Google Workspace tier, and we still haven't found a replacement that we're happy with. Now the reviews are only human, which is good, but they're also the bottleneck.
- PR comments and PR creation. We still need to fix some issues with how the agent writes comments and how the PRs are created. For example, it can't upload the screenshots to a private repo, so I have to drag them in myself.
- I am sure that when we fix those, others will appear. This is a continuous improvement process!
As you can see, none of these depend on the model, they depend on our tools and our process. And that's actually good news, because we can fix them ourselves.
Conclusions
To be honest, there was no magic in the fix: an index, a WHERE in the right place and stop sending 100 MB of text to the browser. Any senior engineer with enough time could have found it. The difference is that I didn't have that time, and now it doesn't matter as much: the model did the boring and rigorous part (reproduce, measure, change one thing at a time, measure again, compare the output for every organization) while I was doing other things, and I only had to steer and review.
So my advice, if you want to go this fast: before spending time on the perfect prompt, spend it on your project. A clear architecture, a good AGENTS.md and small skills that explain how your team works.
What about you? Are you noticing the same jump in your teams? Tell me about it!


